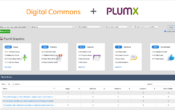
Leading analytics tools like the Digital Commons Dashboard let you measure and report on the impact your work is having locally and around the world.
Who’s reading your institution’s work (and when and where)?
How can you know the difference your scholarship is making without knowing where it’s being read? The Digital Commons Dashboard shows the specific organizations and regions that are engaging with your work (and how they’re finding it), so you can better identify research trends, potential funders, and collaborations.
Reliable metrics you can stand behind
We’ve been tracking readership for over ten years, and we know how dubious most download counts are. Bots, crawlers, and spiders don’t just sound creepy; they massively inflate readership numbers, which degrades the entire system of tracking. Even COUNTER, the organization solely dedicated to ensuring accurate usage data, is not equipped to filter out the more sophisticated non-human activity that downloads human work. That doesn’t sit well with us. So we’ve created our own algorithm, which we’re constantly changing to keep up with evolving bots and other obstacles to clean data.