


As we discussed in last month’s development sneak preview, we’ve got big plans in store for demonstrating repository impact in 2014. One of the new features we’re most excited about coming down the line is the Digital Commons Readership Activity Map, a real-time visualization of full-text downloads across the globe. The moment your institution’s scholarship is downloaded from a Digital Commons collection a pin will drop on your IR’s Readership Activity Map, showing everyone what’s being read in real-time. From Singapore to Salt Lake City, if there are people interested in your collection, there are pins on your map to prove it.
Sounds neat, but why exactly should you be excited about this feature too? Because we believe the Readership Activity Map opens up a number of new possibilities to help demonstrate the impact of your work. Soon, your funders, provosts, directors, deans, and other stakeholders on campus will be able to literally see in real-time the global reach of your institution right on your repository home page.
We’ve got a live example of the Readership Activity Map for you to interact with on the Life Sciences discipline page of the Digital Commons Network. While this first iteration of the Map works best for more established IRs with larger collections, we plan to adapt the visual element to make it available in a compelling manner for every Digital Commons repository within the next several months, eventually making the Map available for each individual collection/journal within your repository. So, for example, if you want to show your Dean of Graduate Studies exactly how many people are accessing your ETD collection and where and when those people are accessing it, this feature will provide a high-impact way to do just that. We also plan to make the Map and the data it collects available to IR Administrators via reports, and to authors via the author dashboard.
As you can imagine, visualizing readership data opens up a number of possibilities, the full scope of which is yours to envision. We want to make the Readership Activity Map as useful to you as possible, so we’re looking for a few pioneers in the Digital Commons Community to pilot the map on their repository homepage. If you think you might be interested, please contact Eli Windchy, VP of Consulting Services at ewindchy@bepress.com.
Stay tuned for next month’s development blog, where we’ll be discussing the launch of the pagination feature mentioned in December’s development sneak preview!
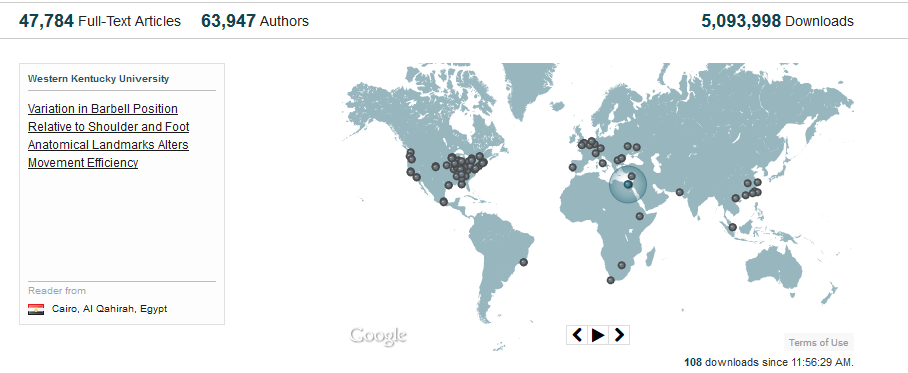
Readership Activity Map for the Life Sciences discipline of the DC Network